开启 Prometheus 监控
这篇文章描述了如何让Prometheus监控所有正在运行的Linkis服务。
1. Prometheus介绍#
1.1 Prometheus是什么#
Prometheus 是一个云原生计算基金会项目,是一个系统和服务监控系统。它以给定的时间间隔从配置的目标收集指标,评估规则表达式,显示结果,并在观察到指定条件时触发警报。
在微服务上下文中,它提供了服务发现功能,可以从服务注册中心动态查找目标,如 Eureka、Consul 等,并通过 http 协议从 API 端点拉取指标。
1.2 Prometheus架构#
下图说明了 Prometheus 的架构及其一些生态系统组件:
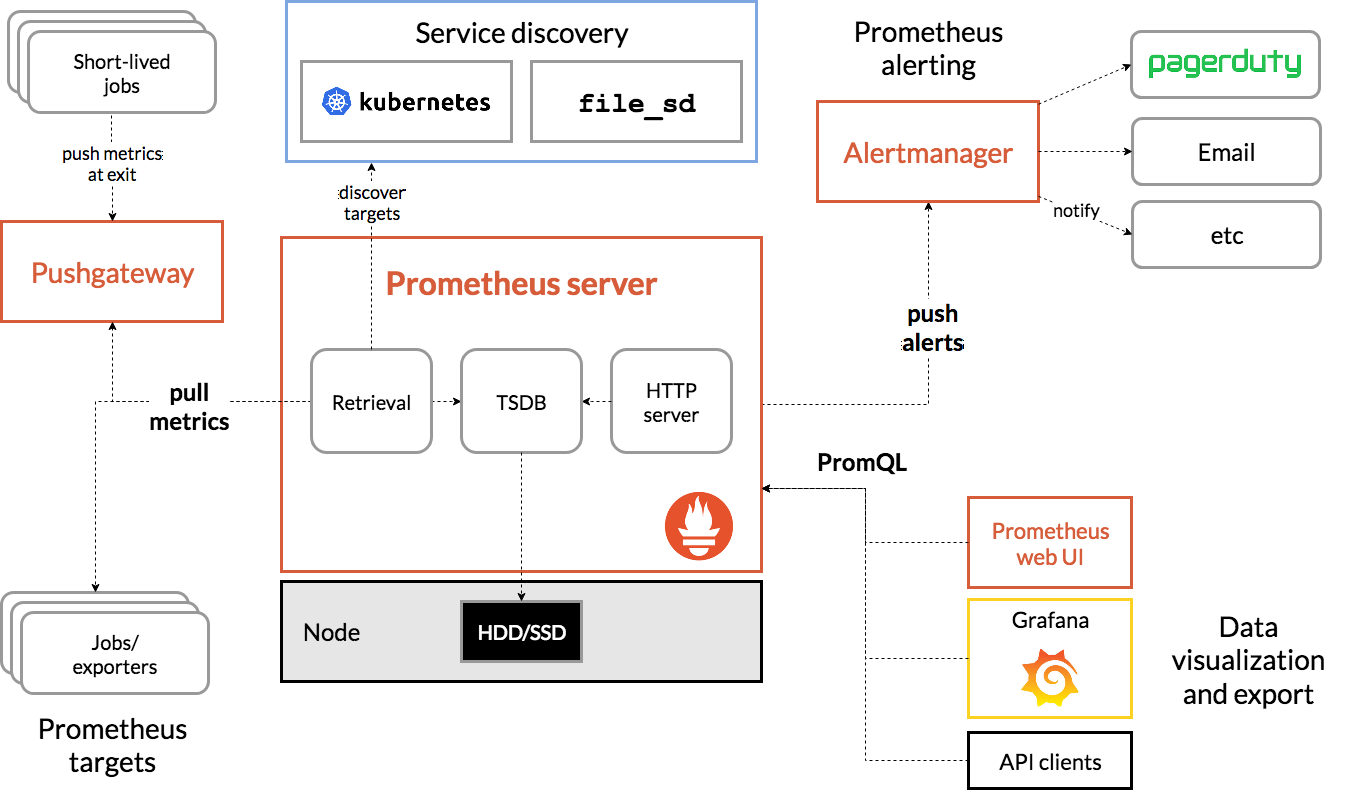
Prometheus可以直接抓取指标,或通过push gateway间接地接收短作业的指标。它将所有抓取的样本存储在本地,并在这些数据上运行规则,以从现有数据聚合和记录新的时间序列,或生成警报。可以使用Grafana或其他API消费者对收集的数据进行可视化。
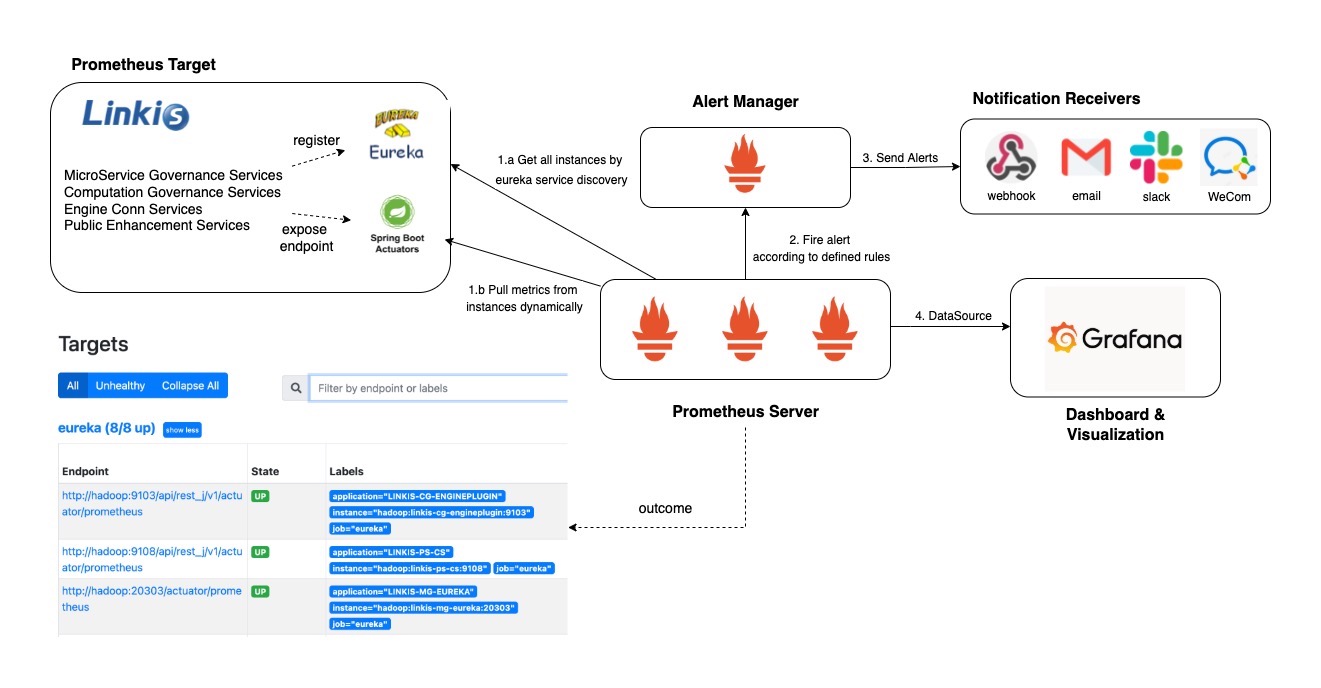
在 Linkis中,我们将使用 Prometheus 中的 Eureka (Service Discover)SD 来使用 Eureka REST API 来查询抓取目标。 Prometheus 将定期检查 REST 端点并为每个应用程序实例创建一个抓取目标。
2. 如何启用 Prometheus#
2.1 安装 Linkis时 启用 Prometheus#
安装脚本中,可以通过开关进行开启
修改安装脚本linkis-env.sh中的PROMETHEUS_ENABLE。
export PROMETHEUS_ENABLE=true运行 install.sh安装linkis后, prometheus的相关配置会出现在下列文件中:
## application-linkis.yml  ##
eureka: instance: metadata-map: prometheus.path: ${prometheus.path:${prometheus.endpoint}}...management: endpoints: web: exposure: include: refresh,info,health,metrics,prometheus## application-eureka.yml ##
eureka: instance: metadata-map: prometheus.path: ${prometheus.path:/actuator/prometheus}...management: endpoints: web: exposure: include: refresh,info,health,metrics,prometheus## linkis.properties ##...wds.linkis.prometheus.enable=truewds.linkis.server.user.restful.uri.pass.auth=/api/rest_j/v1/actuator/prometheus,...如果在引擎内部,如 spark、flink 或 hive,都需要手动添加相同的配置。
## linkis-engineconn.properties ##...wds.linkis.prometheus.enable=truewds.linkis.server.user.restful.uri.pass.auth=/api/rest_j/v1/actuator/prometheus,...2.2 已经安装后 启用 Prometheus#
修改${LINKIS_HOME}/conf/application-linkis.yml
endpoints配置修改 增加prometheus
## application-linkis.yml ##management: endpoints: web: exposure: #增加 prometheus include: refresh,info,health,metrics,prometheus修改${LINKIS_HOME}/conf/application-eureka.yml,endpoints配置修改增加prometheus
## application-eureka.yml ##management: endpoints: web: exposure: #增加 prometheus include: refresh,info,health,metrics,prometheus修改${LINKIS_HOME}/conf/linkis.properties,去掉prometheus.enable前的注释
## linkis.properties ##...wds.linkis.prometheus.enable=true...2.3 启动Linkis#
$ bash linkis-start-all.shLinkis启动后,各个微服务的prometheus端点是可以直接被访问的,例如http://linkishost:9103/api/rest_j/v1/actuator/prometheus
注意
gateway/eureka 服务prometheus端点是没有api/rest_j/v1前缀的 http://linkishost:9001/actuator/prometheus
3. 部署 Prometheus,Alertmanager和 Grafana 示例#
注意
gateway/eureka 服务prometheus端点是没有api/rest_j/v1前缀的 http://linkishost:9001/actuator/prometheus
通常来说,云原生应用程序的监控设置将部署在具有服务发现和高可用性的 Kubernetes 上(例如,使用像 Prometheus Operator 这样的 Kubernetes Operator)。 为了快速展示监控仪表盘,和试验不同类型的图表(histogram/ gauge),你需要一个本地简易的构建。 这个部分将会解释如何在本地通过 Docker Compose搭建Prometheus/Alert Manager和Grafana这一监控套件。
首先,让我们定义该技术栈的通用组件,如下所示:
- Alert Manager容器对外通过端口9093暴露UI,并从alertmanager.conf读取配置;
- Prometheus容器对外通过端口9090暴露UI,从prometheus.yml读取配置文件,从alert_rules.yml中读取报警规则;
- Grafana容器对外通过端口3000暴露UI, 指标数据源定义在grafana_datasources.yml中,配置文件通过grafana_config.ini定义;
- 以下的docker-compose.yml文件总结了上述组件的配置:
## docker-compose.yml ##version: "3"networks:  default:    external: true    name: my-networkservices:  prometheus:    image: prom/prometheus:latest    container_name: prometheus    volumes:      - ./config/prometheus.yml:/etc/prometheus/prometheus.yml      - ./config/alertrule.yml:/etc/prometheus/alertrule.yml      - ./prometheus/prometheus_data:/prometheus    command:      - '--config.file=/etc/prometheus/prometheus.yml'    ports:      - "9090:9090"
  alertmanager:    image: prom/alertmanager:latest    container_name: alertmanager    volumes:      - ./config/alertmanager.yml:/etc/alertmanager/alertmanager.yml    ports:      - "9093:9093"
grafana: image: grafana/grafana:latest container_name: grafana environment: - GF_SECURITY_ADMIN_PASSWORD=123456 - GF_USERS_ALLOW_SIGN_UP=false volumes: - ./grafana/provisioning/dashboards:/etc/grafana/provisioning/dashboards - ./grafana/provisioning/datasources:/etc/grafana/provisioning/datasources - ./grafana/grafana_data:/var/lib/grafana ports: - "3000:3000"然后,为了根据 Prometheus 中的指标定义一些警报,您可以将它们分组到一个 alert_rules.yml 中,这样您就可以在生产实例中配置它们之前验证这些警报是否在本地设置中正确触发。例如,以下配置转换了用于监控 Linkis 服务的常用指标。
- a. Down instance
- b. High Cpu for each JVM instance (>80%)
- c. High Heap memory for each JVM instance (>80%)
- d. High NonHeap memory for each JVM instance (>80%)
- e. High Waiting thread for each JVM instance (100)
## alertrule.yml ##groups:- name: LinkisAlert rules: - alert: LinkisNodeDown expr: last_over_time(up{job="linkis", application=~"LINKISI.*", application!="LINKIS-CG-ENGINECONN"}[1m])== 0 for: 15s labels: severity: critical service: Linkis instance: "{{ $labels.instance }}" annotations: summary: "instance: {{ $labels.instance }} down" description: "Linkis instance(s) is/are down in last 1m" value: "{{ $value }}" - alert: LinkisNodeCpuHigh expr: system_cpu_usage{job="linkis", application=~"LINKIS.*"} >= 0.8 for: 1m labels: severity: warning service: Linkis instance: "{{ $labels.instance }}" annotations: summary: "instance: {{ $labels.instance }} cpu overload" description: "CPU usage is over 80% for over 1min" value: "{{ $value }}" - alert: LinkisNodeHeapMemoryHigh expr: sum(jvm_memory_used_bytes{job="linkis", application=~"LINKIS.*", area="heap"}) by(instance) *100/sum(jvm_memory_max_bytes{job="linkis", application=~"LINKIS.*", area="heap"}) by(instance) >= 50 for: 1m labels: severity: warning service: Linkis instance: "{{ $labels.instance }}" annotations: summary: "instance: {{ $labels.instance }} memory(heap) overload" description: "Memory usage(heap) is over 80% for over 1min" value: "{{ $value }}" - alert: LinkisNodeNonHeapMemoryHigh expr: sum(jvm_memory_used_bytes{job="linkis", application=~"LINKIS.*", area="nonheap"}) by(instance) *100/sum(jvm_memory_max_bytes{job="linkis", application=~"LINKIS.*", area="nonheap"}) by(instance) >= 60 for: 1m labels: severity: warning service: Linkis instance: "{{ $labels.instance }}" annotations: summary: "instance: {{ $labels.instance }} memory(nonheap) overload" description: "Memory usage(nonheap) is over 80% for over 1min" value: "{{ $value }}" - alert: LinkisWaitingThreadHigh expr: jvm_threads_states_threads{job="linkis", application=~"LINKIS.*", state="waiting"} >= 100 for: 1m labels: severity: warning service: Linkis instance: "{{ $labels.instance }}" annotations: summary: "instance: {{ $labels.instance }} waiting threads is high" description: "waiting threads is over 100 for over 1min" value: "{{ $value }}"请注意: 由于服务实例一旦关闭,它就不会成为 Prometheus Eureka SD 的目标之一,并且 up 指标在短时间内不会返回任何数据。因此,我们将收集最后一分钟是否 up=0 以确定服务是否处于活动状态。
第三点, 最重要的是在 prometheus.yml 文件中定义 Prometheus 配置。这将定义:
- 全局设定,例如指标抓取时间间隔,和规则扫描间隔;
- AlertManager的连接信息,告警规则定义路径;
- 应用指标端口的连接信息。
这是 Linkis 的示例配置文件:
## prometheus.yml ### my global configglobal:  scrape_interval:     30s # By default, scrape targets every 15 seconds.  evaluation_interval: 30s # By default, scrape targets every 15 seconds.alerting:  alertmanagers:    - static_configs:        - targets: ['alertmanager:9093']# Load and evaluate rules in this file every 'evaluation_interval' seconds.rule_files:  - "alertrule.yml"
# A scrape configuration containing exactly one endpoint to scrape:# Here it's Prometheus itself.scrape_configs: - job_name: 'prometheus' static_configs: - targets: ['localhost:9090'] - job_name: linkis eureka_sd_configs: # the endpoint of your eureka instance - server: {{linkis-host}}:20303/eureka relabel_configs: - source_labels: [__meta_eureka_app_name] target_label: application - source_labels: [__meta_eureka_app_instance_metadata_prometheus_path] action: replace target_label: __metrics_path__ regex: (.+)第四点,下面的配置定义了警报将如何发送到外部webhook。
## alertmanager.yml ##global:  resolve_timeout: 5m
route:  receiver: 'webhook'  group_by: ['alertname']     # How long to wait to buffer alerts of the same group before sending a notification initially.  group_wait: 1m  # How long to wait before sending an alert that has been added to a group for which there has already been a notification.  group_interval: 5m  # How long to wait before re-sending a given alert that has already been sent in a notification.  repeat_interval: 12h
receivers:- name: 'webhook'  webhook_configs:  - send_resolved: true    url: {{your-webhook-url}}
最后,在定义完所有配置文件以及 docker compose 文件后,我们可以使用 docker-compose up启动监控套件
4. 结果展示#
在 Prometheus 页面上,预计会看到所有 Linkis 服务实例,如下所示:
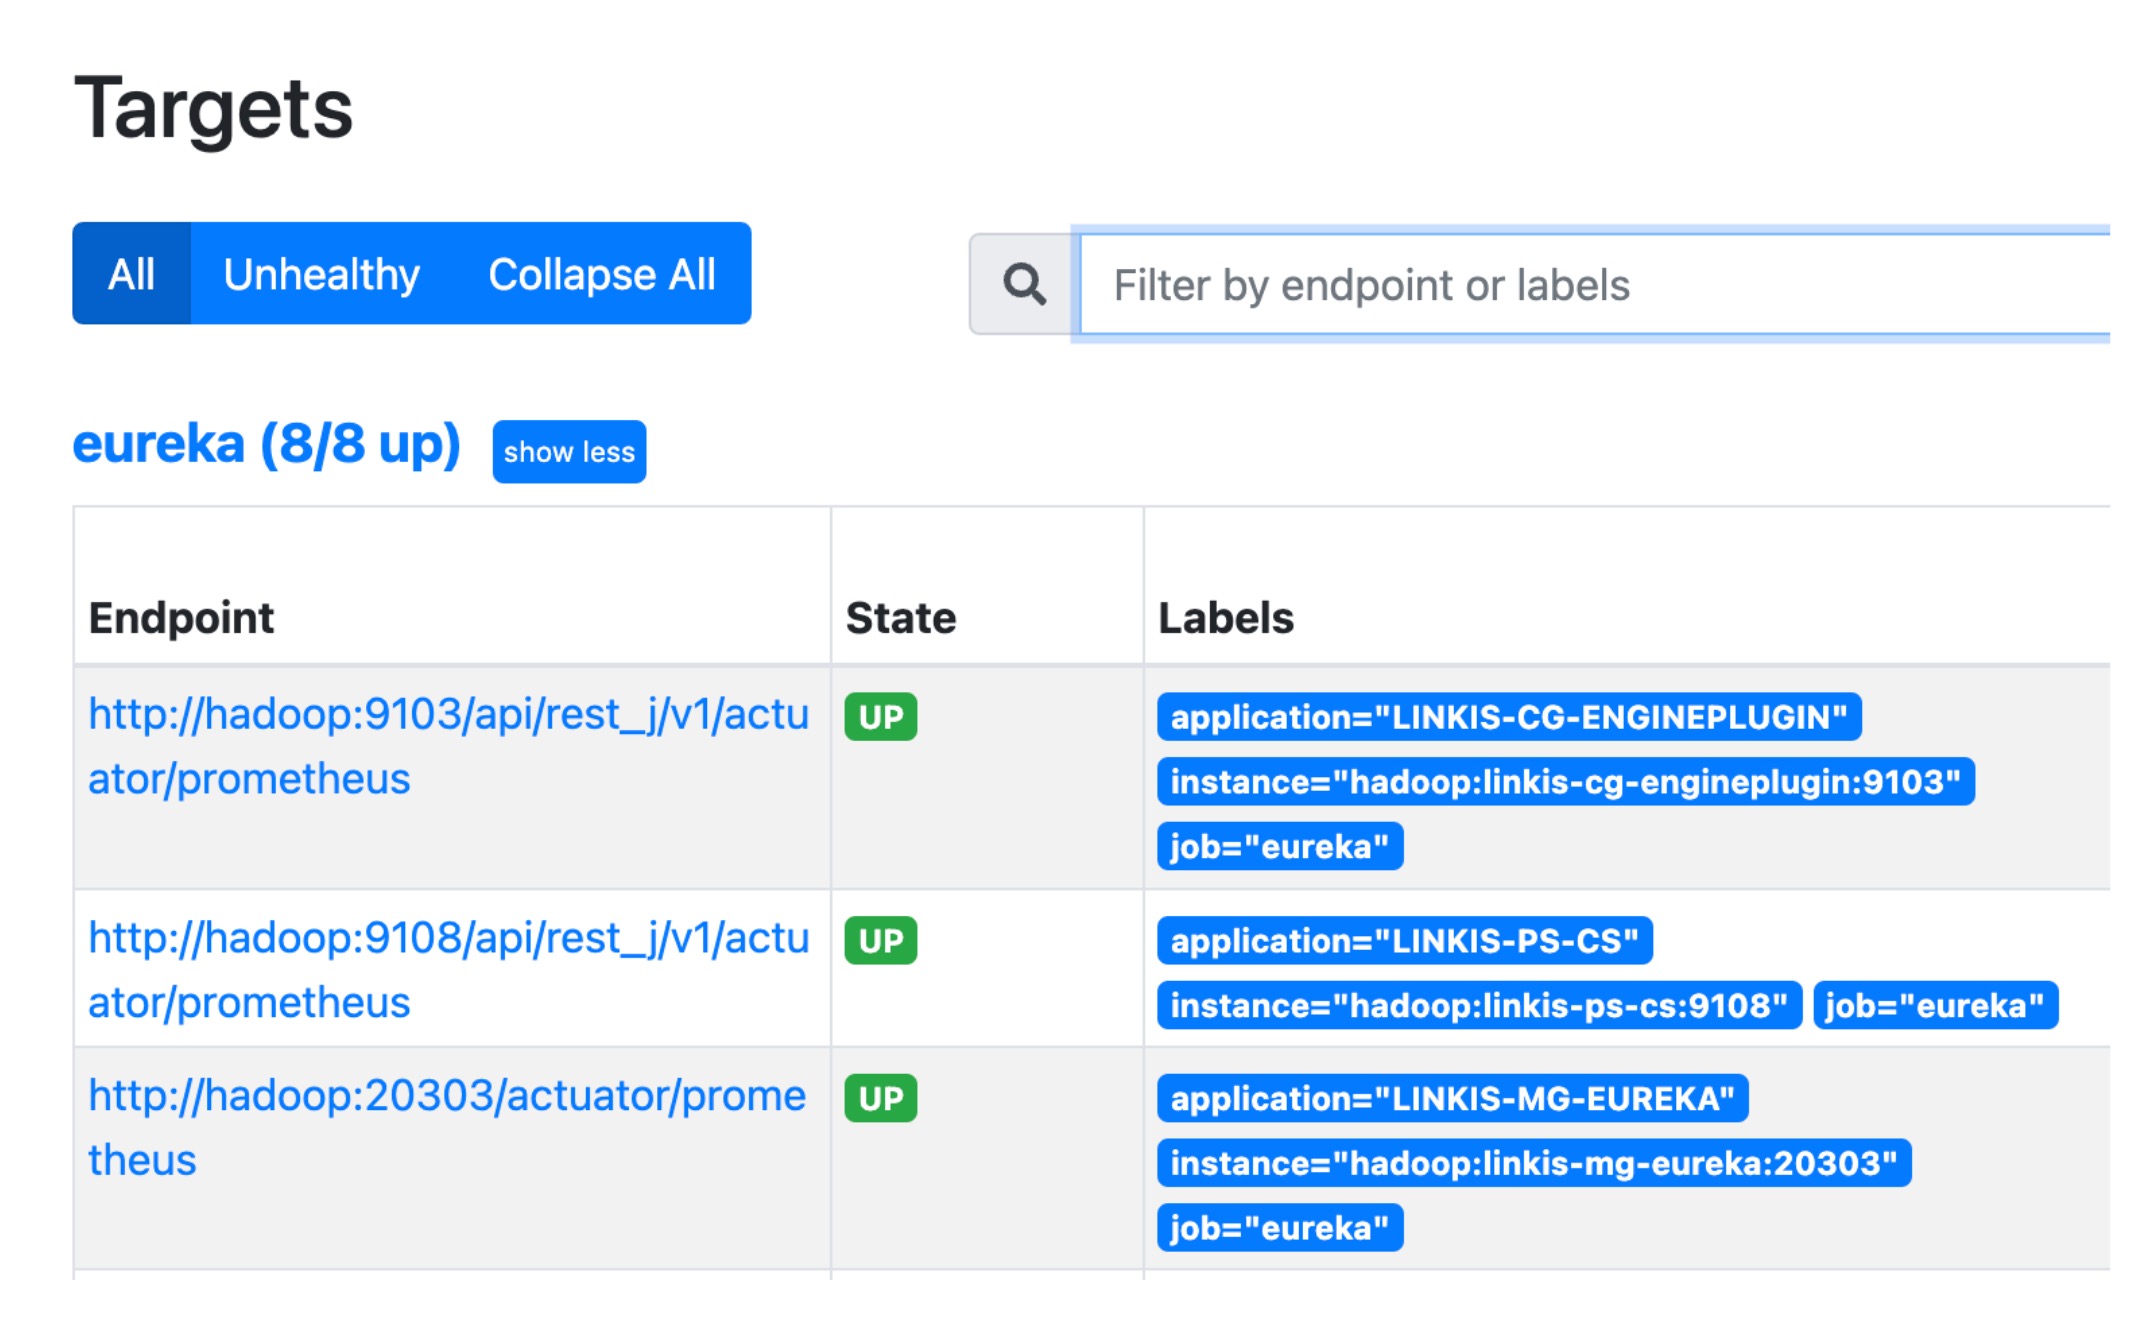
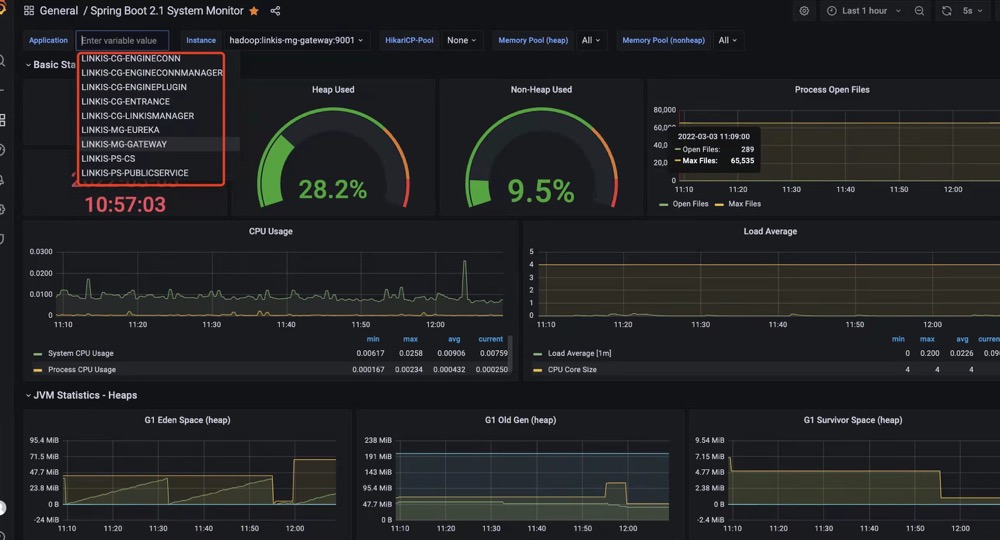
当 Grafana 可访问的时候,您需要在 Grafana 中导入 prometheus 作为数据源,并导入 id 为 11378 的仪表板模板,该模板通常用于 springboot 服务(2.1+)。然后您可以在那里查看 Linkis 的一个实时仪表板。
然后您可以在那里查看 Linkis 的实时仪表板。
您还可以尝试将 Prometheus alter manager 与您自己的 webhook 集成,您可以在其中查看是否触发了告警消息。